7.2 Sample Surveys
7.2: Sample Surveys
7.2.1: The Literary Digest Poll
Incorrect polling techniques used during the 1936 presidential election led to the demise of the popular magazine, The Literary Digest.
Learning Objective
Critique the problems with the techniques used by the Literary Digest Poll
Key Takeaways
Key Points
- As it had done in 1920, 1924, 1928 and 1932, The Literary Digest conducted a straw poll regarding the likely outcome of the 1936 presidential election. Before 1936, it had always correctly predicted the winner. It predicted Landon would beat Roosevelt.
- In November, Landon carried only Vermont and Maine; President F. D. Roosevelt carried the 46 other states. Landon’s electoral vote total of eight is a tie for the record low for a major-party nominee since the American political paradigm of the Democratic and Republican parties began in the 1850s.
- The polling techniques used were to blame, even though they polled 10 million people and got a response from 2.4 million.They polled mostly their readers, who had more money than the typical American during the Great Depression. Higher income people were more likely to vote Republican.
- Subsequent statistical analysis and studies have shown it is not necessary to poll ten million people when conducting a scientific survey. A much lower number, such as 1,500 persons, is adequate in most cases so long as they are appropriately chosen.
- This debacle led to a considerable refinement of public opinion polling techniques and later came to be regarded as ushering in the era of modern scientific public opinion research.
Key Terms
- bellwether
- anything that indicates future trends
- straw poll
- a survey of opinion which is unofficial, casual, or ad hoc
The Literary Digest
The Literary Digest was an influential general interest weekly magazine published by Funk & Wagnalls. Founded by Isaac Kaufmann Funk in 1890, it eventually merged with two similar weekly magazines, Public Opinion and Current Opinion.

The Literary Digest
Cover of the February 19, 1921 edition of The Literary Digest.
History
Beginning with early issues, the emphasis of The Literary Digest was on opinion articles and an analysis of news events. Established as a weekly news magazine, it offered condensations of articles from American, Canadian, and European publications. Type-only covers gave way to illustrated covers during the early 1900s. After Isaac Funk’s death in 1912, Robert Joseph Cuddihy became the editor. In the 1920s, the covers carried full-color reproductions of famous paintings . By 1927, The Literary Digest climbed to a circulation of over one million. Covers of the final issues displayed various photographic and photo-montage techniques. In 1938, it merged with the Review of Reviews, only to fail soon after. Its subscriber list was bought by Time.
Presidential Poll
The Literary Digest is best-remembered today for the circumstances surrounding its demise. As it had done in 1920, 1924, 1928 and 1932, it conducted a straw poll regarding the likely outcome of the 1936 presidential election. Before 1936, it had always correctly predicted the winner.
The 1936 poll showed that the Republican candidate, Governor Alfred Landon of Kansas, was likely to be the overwhelming winner. This seemed possible to some, as the Republicans had fared well in Maine, where the congressional and gubernatorial elections were then held in September, as opposed to the rest of the nation, where these elections were held in November along with the presidential election, as they are today. This outcome seemed especially likely in light of the conventional wisdom, “As Maine goes, so goes the nation,” a saying coined because Maine was regarded as a “bellwether” state which usually supported the winning candidate’s party.
In November, Landon carried only Vermont and Maine; President Franklin Delano Roosevelt carried the 46 other states . Landon’s electoral vote total of eight is a tie for the record low for a major-party nominee since the American political paradigm of the Democratic and Republican parties began in the 1850s. The Democrats joked, “As goes Maine, so goes Vermont,” and the magazine was completely discredited because of the poll, folding soon thereafter.

1936 Presidential Election
This map shows the results of the 1936 presidential election. Red denotes states won by Landon/Knox, blue denotes those won by Roosevelt/Garner. Numbers indicate the number of electoral votes allotted to each state.
In retrospect, the polling techniques employed by the magazine were to blame. Although it had polled ten million individuals (of whom about 2.4 million responded, an astronomical total for any opinion poll), it had surveyed firstly its own readers, a group with disposable incomes well above the national average of the time, shown in part by their ability still to afford a magazine subscription during the depths of the Great Depression, and then two other readily available lists: that of registered automobile owners and that of telephone users. While such lists might come close to providing a statistically accurate cross-section of Americans today, this assumption was manifestly incorrect in the 1930s. Both groups had incomes well above the national average of the day, which resulted in lists of voters far more likely to support Republicans than a truly typical voter of the time. In addition, although 2.4 million responses is an astronomical number, it is only 24% of those surveyed, and the low response rate to the poll is probably a factor in the debacle. It is erroneous to assume that the responders and the non-responders had the same views and merely to extrapolate the former on to the latter. Further, as subsequent statistical analysis and study have shown, it is not necessary to poll ten million people when conducting a scientific survey . A much lower number, such as 1,500 persons, is adequate in most cases so long as they are appropriately chosen.
George Gallup’s American Institute of Public Opinion achieved national recognition by correctly predicting the result of the 1936 election and by also correctly predicting the quite different results of the Literary Digest poll to within about 1%, using a smaller sample size of 50,000. This debacle led to a considerable refinement of public opinion polling techniques and later came to be regarded as ushering in the era of modern scientific public opinion research.
7.2.2: The Year the Polls Elected Dewey
In the 1948 presidential election, the use of quota sampling led the polls to inaccurately predict that Dewey would defeat Truman.
Learning Objective
Criticize the polling methods used in 1948 that incorrectly predicted that Dewey would win the presidency
Key Takeaways
Key Points
- Many polls, including Gallup, Roper, and Crossley, wrongfully predicted the outcome of the election due to their use of quota sampling.
- Quota sampling is when each interviewer polls a certain number of people in various categories that are representative of the whole population, such as age, race, sex, and income.
- One major problem with quota sampling includes the possibility of missing an important representative category that is key to how people vote. Another is the human element involved.
- Truman, as it turned out, won the electoral vote by a 303-189 majority over Dewey, although a swing of just a few thousand votes in Ohio, Illinois, and California would have produced a Dewey victory.
- One of the most famous blunders came when the Chicago Tribune wrongfully printed the inaccurate headline, “Dewey Defeats Truman” on November 3, 1948, the day after Truman defeated Dewey.
Key Terms
- quota sampling
- a sampling method that chooses a representative cross-section of the population by taking into consideration each important characteristic of the population proportionally, such as income, sex, race, age, etc.
- margin of error
- An expression of the lack of precision in the results obtained from a sample.
- quadrennial
- happening every four years
1948 Presidential Election
The United States presidential election of 1948 was the 41stquadrennial presidential election, held on Tuesday, November 2, 1948. Incumbent President Harry S. Truman, the Democratic nominee, successfully ran for election against Thomas E. Dewey, the Republican nominee.
This election is considered to be the greatest election upset in American history. Virtually every prediction (with or without public opinion polls) indicated that Truman would be defeated by Dewey. Both parties had severe ideological splits, with the far left and far right of the Democratic Party running third-party campaigns. Truman’s surprise victory was the fifth consecutive presidential win for the Democratic Party, a record never surpassed since contests against the Republican Party began in the 1850s. Truman’s feisty campaign style energized his base of traditional Democrats, most of the white South, Catholic and Jewish voters, and—in a surprise—Midwestern farmers. Thus, Truman’s election confirmed the Democratic Party’s status as the nation’s majority party, a status it would retain until the conservative realignment in 1968.
Incorrect Polls
As the campaign drew to a close, the polls showed Truman was gaining. Though Truman lost all nine of the Gallup Poll’s post-convention surveys, Dewey’s Gallup lead dropped from 17 points in late September to 9% in mid-October to just 5 points by the end of the month, just above the poll’s margin of error. Although Truman was gaining momentum, most political analysts were reluctant to break with the conventional wisdom and say that a Truman victory was a serious possibility. The Roper Poll had suspended its presidential polling at the end of September, barring “some development of outstanding importance,” which, in their subsequent view, never occurred. Dewey was not unaware of his slippage, but he had been convinced by his advisers and family not to counterattack the Truman campaign.
Let’s take a closer look at the polls. The Gallup, Roper, and Crossley polls all predicted a Dewey win. The actual results are shown in the following table: . How did this happen?
| Candidate | Crossley Poll | Gallup Poll | Roper Poll | Election Results |
|---|---|---|---|---|
| Truman | 45 | 44 | 38 | 50 |
| Dewey | 50 | 50 | 53 | 45 |
| Others | 5 | 6 | 9 | 5 |
1948 Election
The table shows the results of three polls against the actual results in the 1948 presidential election. Notice that Dewey was ahead in all three polls, but ended up losing the election.
The Crossley, Gallup, and Roper organizations all used quota sampling. Each interviewer was assigned a specified number of subjects to interview. Moreover, the interviewer was required to interview specified numbers of subjects in various categories, based on residential area, sex, age, race, economic status, and other variables. The intent of quota sampling is to ensure that the sample represents the population in all essential respects.
This seems like a good method on the surface, but where does one stop? What if a significant criterion was left out–something that deeply affected the way in which people vote? This would cause significant error in the results of the poll. In addition, quota sampling involves a human element. Pollsters, in reality, were left to poll whomever they chose. Research shows that the polls tended to overestimate the Republican vote. In earlier years, the margin of error was large enough that most polls still accurately predicted the winner, but in 1948, their luck ran out. Quota sampling had to go.
Mistake in the Newspapers
One of the most famous blunders came when the Chicago Tribune wrongfully printed the inaccurate headline, “Dewey Defeats Truman” on November 3, 1948, the day after incumbent United States President Harry S. Truman beat Republican challenger and Governor of New York Thomas E. Dewey.
The paper’s erroneous headline became notorious after a jubilant Truman was photographed holding a copy of the paper during a stop at St. Louis Union Station while returning by train from his home in Independence, Missouri to Washington, D.C .
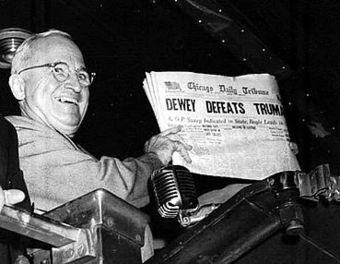
Dewey Defeats Truman
President Truman holds up the newspaper that wrongfully reported his defeat.
Truman, as it turned out, won the electoral vote by a 303-189 majority over Dewey, although a swing of just a few thousand votes in Ohio, Illinois, and California would have produced a Dewey victory.
7.2.3: Using Chance in Survey Work
When conducting a survey, a sample can be chosen by chance or by more methodical methods.
Learning Objective
Distinguish between probability samples and non-probability samples for surveys
Key Takeaways
Key Points
- A probability sampling is one in which every unit in the population has a chance (greater than zero) of being selected in the sample, and this probability can be accurately determined.
- Probability sampling includes simple random sampling, systematic sampling, stratified sampling, and cluster sampling. These various ways of probability sampling have two things in common: every element has a known nonzero probability of being sampled, and random selection is involved at some point.
- Non-probability sampling is any sampling method wherein some elements of the population have no chance of selection (these are sometimes referred to as ‘out of coverage’/’undercovered’), or where the probability of selection can’t be accurately determined.
Key Terms
- purposive sampling
- occurs when the researchers choose the sample based on who they think would be appropriate for the study; used primarily when there is a limited number of people that have expertise in the area being researched
- nonresponse
- the absence of a response
In order to conduct a survey, a sample from the population must be chosen. This sample can be chosen using chance, or it can be chosen more systematically.
Probability Sampling for Surveys
A probability sampling is one in which every unit in the population has a chance (greater than zero) of being selected in the sample, and this probability can be accurately determined. The combination of these traits makes it possible to produce unbiased estimates of population totals, by weighting sampled units according to their probability of selection.
Let’s say we want to estimate the total income of adults living in a given street by using a survey with questions. We visit each household in that street, identify all adults living there, and randomly select one adult from each household. (For example, we can allocate each person a random number, generated from a uniform distribution between 0 and 1, and select the person with the highest number in each household). We then interview the selected person and find their income. People living on their own are certain to be selected, so we simply add their income to our estimate of the total. But a person living in a household of two adults has only a one-in-two chance of selection. To reflect this, when we come to such a household, we would count the selected person’s income twice towards the total. (The person who is selected from that household can be loosely viewed as also representing the person who isn’t selected. )

Income in the United States
Graph of United States income distribution from 1947 through 2007 inclusive, normalized to 2007 dollars. The data is from the US Census, which is a survey over the entire population, not just a sample.
In the above example, not everybody has the same probability of selection; what makes it a probability sample is the fact that each person’s probability is known. When every element in the population does have the same probability of selection, this is known as an ‘equal probability of selection’ (EPS) design. Such designs are also referred to as ‘self-weighting’ because all sampled units are given the same weight.
Probability sampling includes: Simple Random Sampling, Systematic Sampling, Stratified Sampling, Probability Proportional to Size Sampling, and Cluster or Multistage Sampling. These various ways of probability sampling have two things in common: every element has a known nonzero probability of being sampled, and random selection is involved at some point.
Non-Probability Sampling for Surveys
Non-probability sampling is any sampling method wherein some elements of the population have no chance of selection (these are sometimes referred to as ‘out of coverage’/’undercovered’), or where the probability of selection can’t be accurately determined. It involves the selection of elements based on assumptions regarding the population of interest, which forms the criteria for selection. Hence, because the selection of elements is nonrandom, non-probability sampling does not allow the estimation of sampling errors. These conditions give rise to exclusion bias, placing limits on how much information a sample can provide about the population. Information about the relationship between sample and population is limited, making it difficult to extrapolate from the sample to the population.
Let’s say we visit every household in a given street and interview the first person to answer the door. In any household with more than one occupant, this is a non-probability sample, because some people are more likely to answer the door (e.g. an unemployed person who spends most of their time at home is more likely to answer than an employed housemate who might be at work when the interviewer calls) and it’s not practical to calculate these probabilities.
Non-probability sampling methods include accidental sampling, quota sampling, and purposive sampling. In addition, nonresponse effects may turn any probability design into a non-probability design if the characteristics of nonresponse are not well understood, since nonresponse effectively modifies each element’s probability of being sampled.
7.2.4: How Well Do Probability Methods Work?
Even when using probability sampling methods, bias can still occur.
Learning Objective
Analyze the problems associated with probability sampling
Key Takeaways
Key Points
- Undercoverage occurs when some groups in the population are left out of the process of choosing the sample.
- Nonresponse occurs when an individual chosen for the sample can’t be contacted or does not cooperate.
- Response bias occurs when a respondent lies about his or her true beliefs.
- The wording of questions–especially if they are leading questions– can affect the outcome of a survey.
- The larger the sample size, the more accurate the survey.
Key Terms
- undercoverage
- Occurs when a survey fails to reach a certain portion of the population.
- nonresponse
- the absence of a response
- response bias
- Occurs when the answers given by respondents do not reflect their true beliefs.
Probability vs. Non-probability Sampling
In earlier sections, we discussed how samples can be chosen. Failure to use probability sampling may result in bias or systematic errors in the way the sample represents the population. This is especially true of voluntary response samples–in which the respondents choose themselves if they want to be part of a survey– and convenience samples–in which individuals easiest to reach are chosen.
However, even probability sampling methods that use chance to select a sample are prone to some problems. Recall some of the methods used in probability sampling: simple random samples, stratified samples, cluster samples, and systematic samples. In these methods, each member of the population has a chance of being chosen for the sample, and that chance is a known probability.
Problems With Probability Sampling
Random sampling eliminates some of the bias that presents itself in sampling, but when a sample is chosen by human beings, there are always going to be some unavoidable problems. When a sample is chosen, we first need an accurate and complete list of the population. This type of list is often not available, causing most samples to suffer from undercoverage. For example, if we chose a sample from a list of households, we will miss those who are homeless, in prison, or living in a college dorm. In another example, a telephone survey calling landline phones will potentially miss those who are unlisted, those who only use a cell phone, and those who do not have a phone at all. Both of these examples will cause a biased sample in which poor people, whose opinions may very well differ from those of the rest of the population, are underrepresented.
Another source of bias is nonresponse, which occurs when a selected individual cannot be contacted or refuses to participate in the survey. Many people do not pick up the phone when they do not know the person who is calling . Nonresponse is often higher in urban areas, so most researchers conducting surveys will substitute other people in the same area to avoid favoring rural areas. However, if the people eventually contacted differ from those who are rarely at home or refuse to answer questions for one reason or another, some bias will still be present.

Ringing Phone
A third example of bias is called response bias. Respondents may not answer questions truthfully, especially if the survey asks about illegal or unpopular behavior. The race and sex of the interviewer may influence people to respond in a way that is more extreme than their true beliefs. Careful training of pollsters can greatly reduce response bias.
Finally, another source of bias can come in the wording of questions. Confusing or leading questions can strongly influence the way a respondent answers questions.
Conclusion
When reading the results of a survey, it is important to know the exact questions asked, the rate of non-response, and the method of survey before you trust a poll. In addition, remember that a larger sample size will provide more accurate results.
7.2.5: The Gallup Poll
The Gallup Poll is a public opinion poll that conducts surveys in 140 countries around the world.
Learning Objective
Examine the pros and cons of the way in which the Gallup Poll is conducted
Key Takeaways
Key Points
- The Gallup Poll measures and tracks the public’s attitudes concerning virtually every political, social, and economic issues of the day in 140 countries around the world.
- The Gallup Polls have been traditionally known for their accuracy in predicting presidential elections in the United States from 1936 to 2008. They were only incorrect in 1948 and 1976.
- Today, Gallup samples people using both landline telephones and cell phones. They have gained much criticism for not adapting quickly enough for a society that is growing more and more towards using only their cell phones over landlines.
Key Terms
- Objective
- not influenced by the emotions or prejudices
- public opinion polls
- surveys designed to represent the beliefs of a population by conducting a series of questions and then extrapolating generalities in ratio or within confidence intervals
Overview of the Gallup Organization
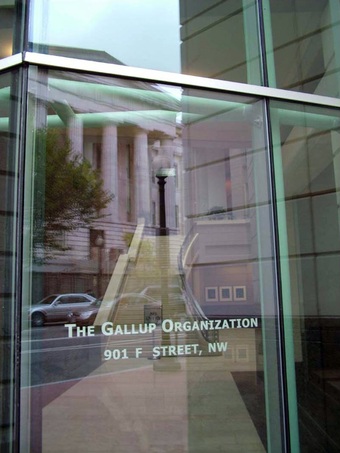
The Gallup Organization
Gallup, Inc. is a research-based performance-management consulting company. Originally founded by George Gallup in 1935, the company became famous for its public opinion polls, which were conducted in the United States and other countries. Today, Gallup has more than 40 offices in 27 countries. The world headquarters are located in Washington, D.C. , while the operational headquarters are in Omaha, Nebraska. Its current Chairman and CEO is Jim Clifton.
History of Gallup
George Gallup founded the American Institute of Public Opinion, the precursor to the Gallup Organization, in Princeton, New Jersey in 1935. He wished to objectively determine the opinions held by the people. To ensure his independence and objectivity, Dr. Gallup resolved that he would undertake no polling that was paid for or sponsored in any way by special interest groups such as the Republican and Democratic parties, a commitment that Gallup upholds to this day.
In 1936, Gallup successfully predicted that Franklin Roosevelt would defeat Alfred Landon for the U.S. presidency; this event quickly popularized the company. In 1938, Dr. Gallup and Gallup Vice President David Ogilvy began conducting market research for advertising companies and the film industry. In 1958, the modern Gallup Organization was formed when George Gallup grouped all of his polling operations into one organization. Since then, Gallup has seen huge expansion into several other areas.
The Gallup Poll
The Gallup Poll is the division of Gallup that regularly conducts public opinion polls in more than 140 countries around the world. Gallup Polls are often referenced in the mass media as a reliable and objective audience measurement of public opinion. Gallup Poll results, analyses, and videos are published daily on Gallup.com in the form of data-driven news. The poll loses about $10 million a year but gives the company the visibility of a very well-known brand.
Historically, the Gallup Poll has measured and tracked the public’s attitudes concerning virtually every political, social, and economic issue of the day, including highly sensitive and controversial subjects. In 2005, Gallup began its World Poll, which continually surveys citizens in more than 140 countries, representing 95% of the world’s adult population. General and regional-specific questions, developed in collaboration with the world’s leading behavioral economists, are organized into powerful indexes and topic areas that correlate with real-world outcomes.
Reception of the Poll
The Gallup Polls have been recognized in the past for their accuracy in predicting the outcome of United States presidential elections, though they have come under criticism more recently. From 1936 to 2008, Gallup correctly predicted the winner of each election–with the notable exceptions of the 1948 Thomas Dewey-Harry S. Truman election, when nearly all pollsters predicted a Dewey victory, and the 1976 election, when they inaccurately projected a slim victory by Gerald Ford over Jimmy Carter. For the 2008 U.S. presidential election, Gallup correctly predicted the winner, but was rated 17th out of 23 polling organizations in terms of the precision of its pre-election polls relative to the final results. In 2012, Gallup’s final election survey had Mitt Romney 49% and Barack Obama 48%, compared to the election results showing Obama with 51.1% to Romney’s 47.2%. Poll analyst Nate Silver found that Gallup’s results were the least accurate of the 23 major polling firms Silver analyzed, having the highest incorrect average of being 7.2 points away from the final result. Frank Newport, the Editor-in-Chief of Gallup, responded to the criticism by stating that Gallup simply makes an estimate of the national popular vote rather than predicting the winner, and that their final poll was within the statistical margin of error.
In addition to the poor results of the poll in 2012, many people are criticizing Gallup on their sampling techniques. Gallup conducts 1,000 interviews per day, 350 days out of the year, among both landline and cell phones across the U.S., for its health and well-being survey. Though Gallup surveys both landline and cell phones, they conduct only 150 cell phone samples out of 1000, making up 15%. The population of the U.S. that relies only on cell phones (owning no landline connections) makes up more than double that number, at 34%. This fact has been a major criticism in recent times of the reliability Gallup polling, compared to other polls, in its failure to compensate accurately for the quick adoption of “cell phone only” Americans.
7.2.6: Telephone Surveys
Telephone surveys can reach a wide range of people very quickly and very inexpensively.
Learning Objective
Identify the advantages and disadvantages of telephone surveys
Key Takeaways
Key Points
- About 95% of people in the United States have a telephone (see, so conducting a poll by calling people is a good way to reach nearly every part of the population.
- Calling people by telephone is a quick process, allowing researches to gain a lot of data in a short amount of time.
- In certain polls, the interviewer or interviewee (or both) may wish to remain anonymous, which can be achieved if the poll is conducted via telephone by a third party.
- Non-response bias is one of the major problems with telephone surveys as many people do not answer calls from people they do not know.
- Due to certain uncontrollable factors (e.g., unlisted phone numbers, people who only use cell phones, or instances when no one is home/available to take pollster calls), undercoverage can negatively affect the outcome of telephone surveys.
Key Terms
- undercoverage
- Occurs when a survey fails to reach a certain portion of the population.
- response bias
- Occurs when the answers given by respondents do not reflect their true beliefs.
- non-response bias
- Occurs when the sample becomes biased because some of those initially selected refuse to respond.
A telephone survey is a type of opinion poll used by researchers. As with other methods of polling, their are advantages and disadvantages to utilizing telephone surveys.
Advantages
- Large scale accessibility. About 95% of people in the United States have a telephone (see ), so conducting a poll by via telephone is a good way to reach most parts of the population.
- Efficient data collection. Conducting calls via telephone produces a quick process, allowing researches to gain a large amount of data in a short amount of time. Previously, pollsters physically had to go to each interviewee’s home (which, obviously, was more time consuming).
- Inexpensive. Phone interviews are not costly (e.g., telephone researchers do not pay for travel).
- Anonymity. In certain polls, the interviewer or interviewee (or both) may wish to remain anonymous, which can be achieved if the poll is conducted over the phone by a third party.
Disadvantages
- Lack of visual materials. Depending on what the researchers are asking, sometimes it may be helpful for the respondent to see a product in person, which of course, cannot be done over the phone.
- Call screening. As some people do not answer calls from strangers, or may refuse to answer the poll, poll samples are not always representative samples from a population due to what is known as non-response bias. In this type of bias, the characteristics of those who agree to be interviewed may be markedly different from those who decline. That is, the actual sample is a biased version of the population the pollster wants to analyze. If those who refuse to answer, or are never reached, have the same characteristics as those who do answer, then the final results should be unbiased. However, if those who do not answer have different opinions, then the results have bias. In terms of election polls, studies suggest that bias effects are small, but each polling firm has its own techniques for adjusting weights to minimize selection bias.
- Undercoverage. Undercoverage is a highly prevalent source of bias. If the pollsters only choose telephone numbers from a telephone directory, they miss those who have unlisted landlines or only have cell phones (which is is becoming more the norm). In addition, if the pollsters only conduct calls between 9:00 a.m and 5:00 p.m, Monday through Friday, they are likely to miss a huge portion of the working population—those who may have very different opinions than the non-working population.
7.2.7: Chance Error and Bias
Chance error and bias are two different forms of error associated with sampling.
Learning Objective
Differentiate between random, or chance, error and bias
Key Takeaways
Key Points
- The error that is associated with the unpredictable variation in the sample is called a random, or chance, error. It is only an “error” in the sense that it would automatically be corrected if we could survey the entire population.
- Random error cannot be eliminated completely, but it can be reduced by increasing the sample size.
- A sampling bias is a bias in which a sample is collected in such a way that some members of the intended population are less likely to be included than others.
- There are various types of bias, including selection from a specific area, self-selection, pre-screening, and exclusion.
Key Terms
- bias
- (Uncountable) Inclination towards something; predisposition, partiality, prejudice, preference, predilection.
- random sampling
- a method of selecting a sample from a statistical population so that every subject has an equal chance of being selected
- standard error
- A measure of how spread out data values are around the mean, defined as the square root of the variance.
Sampling Error
In statistics, a sampling error is the error caused by observing a sample instead of the whole population. The sampling error can be found by subtracting the value of a parameter from the value of a statistic. The variations in the possible sample values of a statistic can theoretically be expressed as sampling errors, although in practice the exact sampling error is typically unknown.
In sampling, there are two main types of error: systematic errors (or biases) and random errors (or chance errors).
Random/Chance Error
Random sampling is used to ensure that a sample is truly representative of the entire population. If we were to select a perfect sample (which does not exist), we would reach the same exact conclusions that we would have reached if we had surveyed the entire population. Of course, this is not possible, and the error that is associated with the unpredictable variation in the sample is called random, or chance, error. This is only an “error” in the sense that it would automatically be corrected if we could survey the entire population rather than just a sample taken from it. It is not a mistake made by the researcher.
Random error always exists. The size of the random error, however, can generally be controlled by taking a large enough random sample from the population. Unfortunately, the high cost of doing so can be prohibitive. If the observations are collected from a random sample, statistical theory provides probabilistic estimates of the likely size of the error for a particular statistic or estimator. These are often expressed in terms of its standard error:

Bias
In statistics, sampling bias is a bias in which a sample is collected in such a way that some members of the intended population are less likely to be included than others. It results in a biased sample, a non-random sample of a population in which all individuals, or instances, were not equally likely to have been selected. If this is not accounted for, results can be erroneously attributed to the phenomenon under study rather than to the method of sampling.
There are various types of sampling bias:
- Selection from a specific real area. For example, a survey of high school students to measure teenage use of illegal drugs will be a biased sample because it does not include home-schooled students or dropouts.
- Self-selection bias, which is possible whenever the group of people being studied has any form of control over whether to participate. Participants’ decision to participate may be correlated with traits that affect the study, making the participants a non-representative sample. For example, people who have strong opinions or substantial knowledge may be more willing to spend time answering a survey than those who do not.
- Pre-screening of trial participants, or advertising for volunteers within particular groups. For example, a study to “prove” that smoking does not affect fitness might recruit at the local fitness center, but advertise for smokers during the advanced aerobics class and for non-smokers during the weight loss sessions.
- Exclusion bias, or exclusion of particular groups from the sample. For example, subjects may be left out if they either migrated into the study area or have moved out of the area.
Attributions
- The Literary Digest Poll
-
“LiteraryDigest-19210219.”
http://en.wikipedia.org/wiki/File:LiteraryDigest-19210219.jpg.
Wikipedia
CC BY-SA. -
“ElectoralCollege1936.”
http://en.wikipedia.org/wiki/File:ElectoralCollege1936.svg.
Wikipedia
CC BY-SA.
- The Year the Polls Elected Dewey
-
“United States presidential election, 1948.”
http://en.wikipedia.org/wiki/United_States_presidential_election,_1948.
Wikipedia
CC BY-SA 3.0. -
“The 1948 Presidential Election Polls.”
http://www.math.uah.edu/stat/data/1948Election.html.
The University of Alabama in Huntsville
CC BY. -
“The 1948 Presidential Election Polls.”
http://www.math.uah.edu/stat/data/1948Election.html.
The University of Alabama in Huntsville
CC BY.
- Using Chance in Survey Work
-
“Sampling (statistics).”
http://en.wikipedia.org/wiki/Sampling_(statistics)%23Probability_and_nonprobability_sampling.
Wikipedia
CC BY-SA 3.0. -
“United States Income Distribution 1947-2007.”
http://commons.wikimedia.org/wiki/File:United_States_Income_Distribution_1947-2007.svg.
Wikimedia
CC BY-SA.
- How Well Do Probability Methods Work?
-
“Sampling (statistics).”
http://en.wikipedia.org/wiki/Sampling_(statistics).
Wikipedia
CC BY-SA 3.0. -
“Tower, Phone, Mail, Icon, Rings – Free image – 25477.”
http://pixabay.com/en/tower-phone-mail-icon-rings-25477/.
Pixabay
CC BY.
- The Gallup Poll
- Telephone Surveys
- Chance Error and Bias
