7.1 Populations and Samples
7.1: Populations and Samples
7.1.1: Populations
In statistics, a population includes all members of a defined group that we are studying for data driven decisions.
Learning Objectives
Key Takeaways
Key Points
- It is often impractical to study an entire population, so we often study a sample from that population to infer information about the larger population as a whole.
- Sometimes a government wishes to try to gain information about all the people living within an area with regard to gender, race, income, and religion. This type of information gathering over a whole population is called a census.
- A subset of a population is called a sub-population.
Key Terms
- heterogeneous
- diverse in kind or nature; composed of diverse parts
- sample
- a subset of a population selected for measurement, observation, or questioning to provide statistical information about the population
Populations
When we hear the word population, we typically think of all the people living in a town, state, or country. This is one type of population. In statistics, the word takes on a slightly different meaning.

Census
This is the logo for the Bureau of the Census in the United States.
A statistical population is a set of entities from which statistical inferences are to be drawn, often based on a random sample taken from the population. For example, if we are interested in making generalizations about all crows, then the statistical population is the set of all crows that exist now, ever existed, or will exist in the future. Since in this case and many others it is impossible to observe the entire statistical population, due to time constraints, constraints of geographical accessibility, and constraints on the researcher’s resources, a researcher would instead observe a statistical sample from the population in order to attempt to learn something about the population as a whole.
Sometimes a government wishes to try to gain information about all the people living within an area with regard to gender, race, income, and religion. This type of information gathering over a whole population is called a census.
Sub-Populations
A subset of a population is called a sub-population. If different sub-populations have different properties, so that the overall population is heterogeneous, the properties and responses of the overall population can often be better understood if the population is first separated into distinct sub-populations. For instance, a particular medicine may have different effects on different sub-populations, and these effects may be obscured or dismissed if such special sub-populations are not identified and examined in isolation.
Similarly, one can often estimate parameters more accurately if one separates out sub-populations. For example, the distribution of heights among people is better modeled by considering men and women as separate sub-populations.
7.1.2: Samples
A sample is a set of data collected and/or selected from a population by a defined procedure.
Learning Objective
Differentiate between a sample and a population
Key Takeaways
Key Points
- A complete sample is a set of objects from a parent population that includes all such objects that satisfy a set of well-defined selection criteria.
- An unbiased (representative) sample is a set of objects chosen from a complete sample using a selection process that does not depend on the properties of the objects.
- A random sample is defined as a sample where each individual member of the population has a known, non-zero chance of being selected as part of the sample.
Key Terms
- census
- an official count of members of a population (not necessarily human), usually residents or citizens in a particular region, often done at regular intervals
- population
- a group of units (persons, objects, or other items) enumerated in a census or from which a sample is drawn
- unbiased
- impartial or without prejudice
What is a Sample?
In statistics and quantitative research methodology, a data sample is a set of data collected and/or selected from a population by a defined procedure.
Typically, the population is very large, making a census or a complete enumeration of all the values in the population impractical or impossible. The sample represents a subset of manageable size. Samples are collected and statistics are calculated from the samples so that one can make inferences or extrapolations from the sample to the population. This process of collecting information from a sample is referred to as sampling.
Types of Samples
A complete sample is a set of objects from a parent population that includes all such objects that satisfy a set of well-defined selection criteria. For example, a complete sample of Australian men taller than 2 meters would consist of a list of every Australian male taller than 2 meters. It wouldn’t include German males, or tall Australian females, or people shorter than 2 meters. To compile such a complete sample requires a complete list of the parent population, including data on height, gender, and nationality for each member of that parent population. In the case of human populations, such a complete list is unlikely to exist, but such complete samples are often available in other disciplines, such as complete magnitude-limited samples of astronomical objects.
Samples
Online and phone-in polls produce biased samples because the respondents are self-selected. In self-selection bias, those individuals who are highly motivated to respond– typically individuals who have strong opinions– are over-represented, and individuals who are indifferent or apathetic are less likely to respond.
An unbiased (representative) sample is a set of objects chosen from a complete sample using a selection process that does not depend on the properties of the objects. For example, an unbiased sample of Australian men taller than 2 meters might consist of a randomly sampled subset of 1% of Australian males taller than 2 meters. However, one chosen from the electoral register might not be unbiased since, for example, males aged under 18 will not be on the electoral register. In an astronomical context, an unbiased sample might consist of that fraction of a complete sample for which data are available, provided the data availability is not biased by individual source properties.
The best way to avoid a biased or unrepresentative sample is to select a random sample, also known as a probability sample. A random sample is defined as a sample wherein each individual member of the population has a known, non-zero chance of being selected as part of the sample. Several types of random samples are simple random samples, systematic samples, stratified random samples, and cluster random samples.
A sample that is not random is called a non-random sample, or a non-probability sampling. Some examples of nonrandom samples are convenience samples, judgment samples, and quota samples.
7.1.3: Random Sampling
A random sample, also called a probability sample, is taken when each individual has an equal probability of being chosen for the sample.
Learning Objectives
Categorize a random sample as a simple random sample, a stratified random sample, a cluster sample, or a systematic sample
Key Takeaways
Key Points
- A simple random sample (SRS) of size n consists of n individuals from the population chosen in such a way that every set on n individuals has an equal chance of being in the selected sample.
- Stratified sampling occurs when a population embraces a number of distinct categories and is divided into sub-populations, or strata. At this stage, a simple random sample would be chosen from each stratum and combined to form the full sample.
- Cluster sampling divides the population into groups, or clusters. Some of these clusters are randomly selected. Then, all the individuals in the chosen cluster are selected to be in the sample.
- Systematic sampling relies on arranging the target population according to some ordering scheme and then selecting elements at regular intervals through that ordered list.
Key Terms
- stratum
- a category composed of people with certain similarities, such as gender, race, religion, or even grade level
- population
- a group of units (persons, objects, or other items) enumerated in a census or from which a sample is drawn
- cluster
- a significant subset within a population
Simple Random Sample (SRS)
There is a variety of ways in which one could choose a sample from a population. A simple random sample (SRS) is one of the most typical ways. Also commonly referred to as a probability sample, a simple random sample of size n consists of n individuals from the population chosen in such a way that every set of n individuals has an equal chance of being in the selected sample. An example of an SRS would be drawing names from a hat. An online poll in which a person is asked to given their opinion about something is not random because only those people with strong opinions, either positive or negative, are likely to respond. This type of poll doesn’t reflect the opinions of the apathetic .
Simple random samples are not perfect and should not always be used. They can be vulnerable to sampling error because the randomness of the selection may result in a sample that doesn’t reflect the makeup of the population. For instance, a simple random sample of ten people from a given country will on average produce five men and five women, but any given trial is likely to over-represent one sex and under-represent the other. Systematic and stratified techniques, discussed below, attempt to overcome this problem by using information about the population to choose a more representative sample.
In addition, SRS may also be cumbersome and tedious when sampling from an unusually large target population. In some cases, investigators are interested in research questions specific to subgroups of the population. For example, researchers might be interested in examining whether cognitive ability as a predictor of job performance is equally applicable across racial groups. SRS cannot accommodate the needs of researchers in this situation because it does not provide sub-samples of the population. Stratified sampling, which is discussed below, addresses this weakness of SRS.
Stratified Random Sample
When a population embraces a number of distinct categories, it can be beneficial to divide the population in sub-populations called strata. These strata must be in some way important to the response the researcher is studying. At this stage, a simple random sample would be chosen from each stratum and combined to form the full sample.
For example, let’s say we want to sample the students of a high school to see what type of music they like to listen to, and we want the sample to be representative of all grade levels. It would make sense to divide the students into their distinct grade levels and then choose an SRS from each grade level. Each sample would be combined to form the full sample.
Cluster Sample
Cluster sampling divides the population into groups, or clusters. Some of these clusters are randomly selected. Then, all the individuals in the chosen cluster are selected to be in the sample. This process is often used because it can be cheaper and more time-efficient.
For example, while surveying households within a city, we might choose to select 100 city blocks and then interview every household within the selected blocks, rather than interview random households spread out over the entire city.
Systematic Sample
Systematic sampling relies on arranging the target population according to some ordering scheme and then selecting elements at regular intervals through that ordered list. Systematic sampling involves a random start and then proceeds with the selection of every th element from then onward. In this case,
. It is important that the starting point is not automatically the first in the list, but is instead randomly chosen from within the first to the th element in the list. A simple example would be to select every 10th name from the telephone directory (an ‘every 10th‘ sample, also referred to as ‘sampling with a skip of 10’).
7.1.4: Random Assignment of Subjects
Random assignment helps eliminate the differences between the experimental group and the control group.
Learning Objective
Discover the importance of random assignment of subjects in experiments
Key Takeaways
Key Points
- Researchers randomly assign participants in a study to either the experimental group or the control group. Dividing the participants randomly reduces group differences, thereby reducing the possibility that confounding factors will influence the results.
- By randomly assigning subjects to groups, researchers are able to feel confident that the groups are the same in terms of all variables except the one which they are manipulating.
- A randomly assigned group may statistically differ from the mean of the overall population, but this is rare.
- Random assignment became commonplace in experiments in the late 1800s due to the influence of researcher Charles S. Peirce.
Key Terms
- null hypothesis
- A hypothesis set up to be refuted in order to support an alternative hypothesis; presumed true until statistical evidence in the form of a hypothesis test indicates otherwise.
- control
- a separate group or subject in an experiment against which the results are compared where the primary variable is low or nonexistence
Importance of Random Assignment
When designing controlled experiments, such as testing the effects of a new drug, statisticians often employ an experimental design, which by definition involves random assignment. Random assignment, or random placement, assigns subjects to treatment and control (no treatment) group(s) on the basis of chance rather than any selection criteria. The aim is to produce experimental groups with no statistically significant characteristics prior to the experiment so that any changes between groups observed after experimental activities have been completed can be attributed to the treatment effect rather than to other, pre-existing differences among individuals between the groups.

Control Group
Take identical growing plants, randomly assign them to two groups, and give fertilizer to one of the groups. If there are differences between the fertilized plant group and the unfertilized “control” group, these differences may be due to the fertilizer.
In experimental design, random assignment of participants in experiments or treatment and control groups help to ensure that any differences between or within the groups are not systematic at the outset of the experiment. Random assignment does not guarantee that the groups are “matched” or equivalent; only that any differences are due to chance.
Random assignment is the desired assignment method because it provides control for all attributes of the members of the samples—in contrast to matching on only one or more variables—and provides the mathematical basis for estimating the likelihood of group equivalence for characteristics one is interested in, both for pre-treatment checks on equivalence and the evaluation of post treatment results using inferential statistics.
Random Assignment Example
Consider an experiment with one treatment group and one control group. Suppose the experimenter has recruited a population of 50 people for the experiment—25 with blue eyes and 25 with brown eyes. If the experimenter were to assign all of the blue-eyed people to the treatment group and the brown-eyed people to the control group, the results may turn out to be biased. When analyzing the results, one might question whether an observed effect was due to the application of the experimental condition or was in fact due to eye color.
With random assignment, one would randomly assign individuals to either the treatment or control group, and therefore have a better chance at detecting if an observed change were due to chance or due to the experimental treatment itself.
If a randomly assigned group is compared to the mean, it may be discovered that they differ statistically, even though they were assigned from the same group. To express this same idea statistically–if a test of statistical significance is applied to randomly assigned groups to test the difference between sample means against the null hypothesis that they are equal to the same population mean (i.e., population mean of differences = 0), given the probability distribution, the null hypothesis will sometimes be “rejected”–that is, deemed implausible. In other words, the groups would be sufficiently different on the variable tested to conclude statistically that they did not come from the same population, even though they were assigned from the same total group. In the example above, using random assignment may create groups that result in 20 blue-eyed people and 5 brown-eyed people in the same group. This is a rare event under random assignment, but it could happen, and when it does, it might add some doubt to the causal agent in the experimental hypothesis.
History of Random Assignment
Randomization was emphasized in the theory of statistical inference of Charles S. Peirce in “Illustrations of the Logic of Science” (1877–1878) and “A Theory of Probable Inference” (1883). Peirce applied randomization in the Peirce-Jastrow experiment on weight perception. Peirce randomly assigned volunteers to a blinded, repeated-measures design to evaluate their ability to discriminate weights. His experiment inspired other researchers in psychology and education, and led to a research tradition of randomized experiments in laboratories and specialized textbooks in the nineteenth century.
7.1.5: Surveys or Experiments?
Surveys and experiments are both statistical techniques used to gather data, but they are used in different types of studies.
Learning Objective
Distinguish between when to use surveys and when to use experiments
Key Takeaways
Key Points
- A survey is a technique that involves questionnaires and interviews of a sample population with the intention of gaining information, such as opinions or facts, about the general population.
- An experiment is an orderly procedure carried out with the goal of verifying, falsifying, or establishing the validity of a hypothesis.
- A survey would be useful if trying to determine whether or not people would be interested in trying out a new drug for headaches on the market. An experiment would test the effectiveness of this new drug.
Key Term
- placebo
- an inactive substance or preparation used as a control in an experiment or test to determine the effectiveness of a medicinal drug
What is a Survey?
Survey methodology involves the study of the sampling of individual units from a population and the associated survey data collection techniques, such as questionnaire construction and methods for improving the number and accuracy of responses to surveys.
Statistical surveys are undertaken with a view towards making statistical inferences about the population being studied, and this depends strongly on the survey questions used. Polls about public opinion, public health surveys, market research surveys, government surveys, and censuses are all examples of quantitative research that use contemporary survey methodology to answers questions about a population. Although censuses do not include a “sample,” they do include other aspects of survey methodology, like questionnaires, interviewers, and nonresponse follow-up techniques. Surveys provide important information for all kinds of public information and research fields, like marketing research, psychology, health, and sociology.
Since survey research is almost always based on a sample of the population, the success of the research is dependent on the representativeness of the sample with respect to a target population of interest to the researcher.
What is an Experiment?
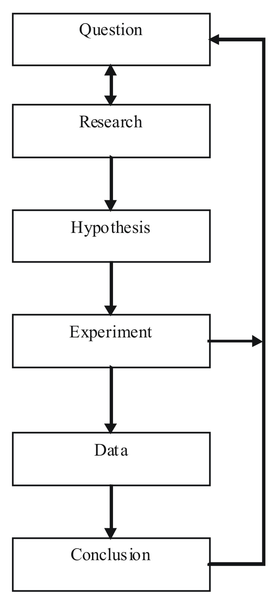
Scientific Method
This flow chart shows the steps of the scientific method.
An experiment is an orderly procedure carried out with the goal of verifying, falsifying, or establishing the validity of a hypothesis. Experiments provide insight into cause-and-effect by demonstrating what outcome occurs when a particular factor is manipulated. Experiments vary greatly in their goal and scale, but always rely on repeatable procedure and logical analysis of the results in a method called the scientific method . A child may carry out basic experiments to understand the nature of gravity, while teams of scientists may take years of systematic investigation to advance the understanding of a phenomenon. Experiments can vary from personal and informal (e.g. tasting a range of chocolates to find a favorite), to highly controlled (e.g. tests requiring a complex apparatus overseen by many scientists that hope to discover information about subatomic particles). Uses of experiments vary considerably between the natural and social sciences.
In statistics, controlled experiments are often used. A controlled experiment generally compares the results obtained from an experimental sample against a control sample, which is practically identical to the experimental sample except for the one aspect whose effect is being tested (the independent variable). A good example of this would be a drug trial, where the effects of the actual drug are tested against a placebo.
When is One Technique Better Than the Other?
Surveys and experiments are both techniques used in statistics. They have similarities, but an in depth look into these two techniques will reveal how different they are. When a businessman wants to market his products, it’s a survey he will need and not an experiment. On the other hand, a scientist who has discovered a new element or drug will need an experiment, and not a survey, to prove its usefulness. A survey involves asking different people about their opinion on a particular product or about a particular issue, whereas an experiment is a comprehensive study about something with the aim of proving it scientifically. They both have their place in different types of studies.
Attributions
- Populations
-
“Statistical population.”
http://en.wikipedia.org/wiki/Statistical_population.
Wikipedia
CC BY-SA 3.0. -
“Census Bureau seal.”
http://commons.wikimedia.org/wiki/File:Census_Bureau_seal.jpg.
Wikimedia
CC BY-SA.
- Samples
-
“Boundless.”
https://www.boundless.com/psychology/psychology-as-science/descriptive-techniques/explanation-random-sampling/.
Boundless Learning
CC BY.
- Random Sampling
-
“Sampling (statistics).”
http://en.wikipedia.org/wiki/Sampling_(statistics)%23Sampling_methods.
Wikipedia
CC BY-SA 3.0. -
“Boundless.”
https://www.boundless.com/psychology/psychology-as-science/descriptive-techniques/explanation-random-sampling/.
Boundless Learning
CC BY.
- Random Assignment of Subjects
-
“Starr 011107-0010 Argyroxiphium sandwicense subsp.
macrocephalum.”
http://en.wikipedia.org/wiki/File:Starr_011107-0010_Argyroxiphium_sandwicense_subsp._macrocephalum.jpg.
Wikipedia
CC BY-SA.
- Surveys or Experiments?
-
“The Scientific Method.”
http://commons.wikimedia.org/wiki/File:The_Scientific_Method.png.
Wikimedia
CC BY-SA.
