7 ENZYMES
Learning Objectives
- Observe the enzyme, sucrase, facilitate the breakdown of molecules.
- Monitor the effects of environmental conditions on enzymatic activity.
- Determine impact of concentration on sucrase activity.
Activity
- How would the concentration of an enzyme, its substrate(s), and its product(s) change over time as an enzymatic reaction takes place?
- What molecule(s) would you measure to monitor the progress of an enzymatic reaction? How might you observe the relative concentrations of these molecules over the course of the enzymatic reaction?
- Discuss the answers to questions 1 and 2 with your group.
Measuring the Enzymatic Activity of Sucrase
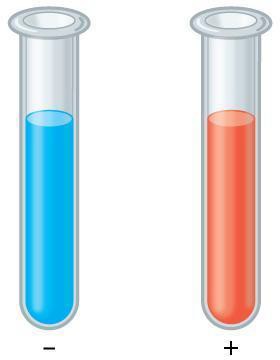
How would we measure the activity of a specific enzyme? One easy way to measure the concentration of a chemical is by using a colored indicator. As an enzymatic reaction proceeds, the color of the solution changes and can be monitored visually.
In this lab, you will measure the enzymatic activity of sucrase, an enzyme that breaks down sucrose, a disaccharide found in table sugar, into the monosaccharides glucose and fructose.
Glucose can be detected using Benedicts Test.
|
Results of Benedicts Test (after boiling) |
||
|---|---|---|
|
Color |
Descriptive amount |
Estimated amount |
|
Blue |
None |
0 g% glucose |
|
Green |
Traceable |
0.5-1 g% glucose |
|
Yellow |
Low |
1-1.5 g% glucose |
|
Orange |
Moderate |
1.5-2 g% glucose |
|
Red |
High |
>2 g% glucose |
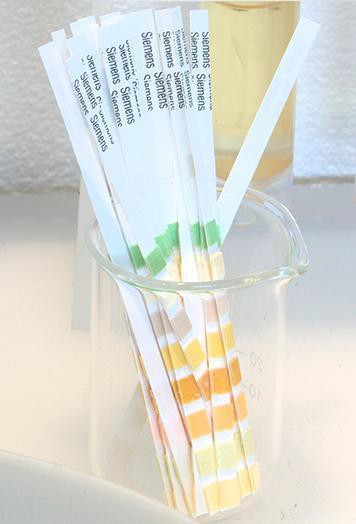
Glucose, can also be detected visually using glucose detection strips, which can also be purchased from pharmacies. One type of glucose detection strip contains the dye toluidine blue and the enzyme glucose oxidase (Figure 7.2). Glucose oxidase within the strip converts the glucose to gluconic acid and hydrogen peroxide. Hydrogen peroxide then interacts with the toluidine blue within the strip, bringing about a color change from blue to green to yellow to brown.
Safety Precautions
- Goggles should be worn at all times while in laboratory.
- No open-toe shoes worn in laboratory.
- Measure fluids carefully using graduated cylinders to avoid breakage and spillage.
- Inform your teacher immediately of any broken glassware as it could cause injuries.
- Clean up any spilled fluids to prevent other people from slipping.
For this activity, you will need the following:
- Graduated cylinder (to measure a minimum of 5mL samples)
- Beaker
- Water
- Sucrose
- Sucrase solution
- Stirring rod
- Test tubes
- Glucose
- Balance
- Labeling pencil
- Benedicts solution
- Graph paper
- Timer
- Hot plate
Structured Inquiry
Step 1: Place a beaker filled halfway with tap water onto a hot plate. Heat the water to boiling.
Step 2: Collect 5 test tubes. You may use a marker to label the tubes 1-5. Be sure to shake the bottle of sucrose and mix the solution. Then fill each test tube as listed in the chart that follows:
|
|
Substrate |
Enzyme Amount |
Estimated amount of glucose present |
|---|---|---|---|
|
1 |
2mL sucrose |
0 mL sucrase |
|
|
2 |
2mL sucrose |
0.5 mL sucrase |
|
|
3 |
2mL sucrose |
1 mL sucrase |
|
|
4 |
2mL sucrose |
1.5 mL sucrase |
|
|
5 |
2mL sucrose |
3 mL sucrase |
|
Step 3: Add 3mL of Benedict’s reagent to each test tube. Note the color.
Step 4: Place the test tubes in the beaker of boiling water for 5 minutes and record any color changes.
Step 5:After 5 minutes, you can use test tube holders to move each tube from the beaker to a test tube rack. Note the color change and allow time for the solution to cool before cleaning.
Guided Inquiry
Step 1: How do you think increasing the amount of sucrose will affect glucose formation? How do you think decreasing the amount of sucrose will affect glucose formation? Formulate a hypothesis involving the effect of the sucrose amount on glucose formation. Write your hypotheses and predictions on your paper.
Step 2: Collect 5 test tubes. You may use a marker to label the tubes 1-5. Be sure to shake the bottle of sucrose and mix the solution. Then fill each test tube as listed in the chart that follows:
|
|
Substrate |
Enzyme Amount |
Estimated amount of glucose present |
|---|---|---|---|
|
1 |
0mL sucrose + 2mL DI water |
3 mL sucrase |
|
|
2 |
0.5mL sucrose + 1.5mL DI water |
3 mL sucrase |
|
|
3 |
1mL sucrose + 1mL DI water |
3 mL sucrase |
|
|
4 |
1.5mL sucrose + 0.5mL DI water |
3 mL sucrase |
|
|
5 |
2mL sucrose |
3 mL sucrase |
|
Step 3: Add 3mL of Benedict’s reagent to each test tube. Note the color.
Step 4: Place the test tubes in the beaker of boiling water for 5 minutes and record any color changes.
Step 5:After 5 minutes, you can use test tube holders to move each tube from the beaker to a test tube rack. Note the color change and allow time for the solution to cool before cleaning.
Assessment
- Assume a scenario that breaks all lactose provided into glucose and galactose. Based upon this assumption, if one diluted the amount of milk by half in the tube containing milk and the lactase enzyme, what would happen to the amount of glucose produced? Explain why in terms of molecular interactions of the substrate with the enzyme and enzyme function.
- Describe the role of each of the following in the experiment:
- Water-only tube
- Tube of 20 mg/mL glucose solution
Activity
- Which environmental conditions could alter the rate at which an enzymatic reaction takes place? Why would this occur?
- Which environmental conditions could affect an enzyme’s active site? Why would this occur?
- Discuss the answers to questions 1 and 2 with your group.
The Effects of Temperature and pH on Enzymatic Activity
What types of environmental factors may affect enzymatic activity? Why? Several factors known to affect enzymatic activity are temperature, pH, and substrate concentration. In a typical chemical reaction, increasing temperature causes the substrates to become more energetic and hence more likely to bump into each other in solution. However, changes in temperature can cause an enzyme to denature, which changes the three-dimensional structure of the enzyme molecule. In addition, cellular enzymes each work within a certain pH range because the side chains within their active sites are optimized for efficient catalysis and are thus quite sensitive to changes in pH. Different enzymes may have different pH ranges and pH optimal conditions under which they work maximally; while many enzymes work best around a neutral pH, some are adapted to an acidic pH, while others are adapted to a basic pH.
Safety Precautions
- Goggles should be worn at all times while in laboratory.
- No open-toe shoes worn in laboratory.
- Measure fluids carefully using graduated cylinders to avoid breakage and spillage.
- Be careful not to touch solutions of concentrated acids and bases directly.
- Take precautions when using a hot plate and touching hot glassware.
- Inform your teacher immediately of any broken glassware as it could cause injuries.
- Clean up any spilled fluids to prevent other people from slipping.
For this activity, you will need the following:
- Graduated cylinder
- Beaker
- Water
- Buffer solutions with a variety of pH 4.0, pH 7.0, pH 9.0 or other
- Sucrase
- Test tubes
- Stirring rod
- Labeling pencil
- Hot plate
- Ice bath
- Incubator set to 37 °C
- Thermometers
- Benedicts
- Timer
- Graph paper
For this activity, you will work in pairs.
Structured Inquiry: Temperature
Step 1: Prepare a large beaker of boiling tap water on a hot plate. Prepare five identical test tubes, each containing 2 mL of sucrose. Label four test tubes accordingly with each of the following temperatures: 0°C (ice bath), 30°C (room), water bath 60°C, and 100°C (boiling temperature). Place one tube of sucrose at each of the four temperatures. Create a data table to enter your results for each of these test tubes over time. Measure the room temperature using a thermometer.
Step 2: Based upon your knowledge of enzymes and the effects of temperature on their activity, rank the tubes from fastest (1) to slowest (5) glucose production predicted over time after the addition of sucrase. Add your predictions to the data table you created in step 1.
Step 3: Discuss with your partner how you could use the data you collect to calculate a rate of sucrase activity for each temperature.
Step 4: Collect 8 test tubes. Label the test tubes according to the chart below. Be sure to shake the bottle of sucrose and mix the solution. Then, fill the test tube keeping the substrate (sucrose) separate from the enzyme (sucrase) during this step. Place the test tubes in the designated water baths for 15 minutes. Monitor the temperatures of each of these locations, both before and after the experiment using thermometers.
|
|
Solution |
|
Solution |
Temperature |
|---|---|---|---|---|
|
1 |
2mL sucrose and 2mL of pH buffer 4.4 |
1 |
3mL sucrase |
0°C (ice bath) |
|
2 |
2mL sucrose and 2mL of pH buffer 4.4 |
2 |
3mL sucrase |
30°C (room) |
|
3 |
2mL sucrose and 2mL of pH buffer 4.4 |
3 |
3mL sucrase |
60°C (warm bath) |
|
4 |
2mL sucrose and 2mL of pH buffer 4.4 |
4 |
3mL sucrase |
100°C (boiling) |
Step 5: Pour the enzyme solutions (separate tubes) into the corresponding substrate solutions. Return the combined tubes to the water bath for 5 additional minutes.
Step 6:Add 3mL of Benedict’s reagent to each test tube. Note the color.
Step 7: Place the test tubes in the beaker of boiling water for 5 minutes and record any color changes.
|
|
Solution |
Temperature |
Estimated amount of glucose present |
|---|---|---|---|
|
1 |
sucrose + sucrase |
0°C (ice bath) |
|
|
2 |
sucrose + sucrase |
30°C (room) |
|
|
3 |
sucrose + sucrase |
60°C (warm bath) |
|
|
4 |
sucrose + sucrase |
100°C (boiling) |
|
Guided Inquiry: Temperature
Step 1: Based on the data already collected, predict a temperature range that includes the optimal temperature for sucrase activity. How do you think you could more finely pinpoint the optimal temperature for sucrase activity? Write your ideas on your paper.
Step 2: Determine how you could change the set-up of your test tubes to determine the optimal temperature for sucrase activity. Once your teacher approves, create a table to record your data, prepare your test tubes per your design, and record data on glucose production every 3 minutes for 15 minutes. Determine the rates of sucrase enzyme activity under each of your chosen conditions as you did in the Structured Inquiry. Graph the rates of sucrase enzyme activity versus temperature and estimate the optimal temperature.
Step 3: Are the predictions you made in step 1 supported by your data? Is there any way you can improve your experiment? Discuss your answer with your lab partner and write it on your paper.
Structured Inquiry: pH
Step 1: Prepare three test tubes, each containing 2 mL of sucrose, and label the three tubes as follows: 4.0 (acidic), 7.0 (neutral), and 9.0 (basic). To the first test tube, add 1 mL of pH 4.0 buffer. To the second test tube, add 1 mL of pH 7.0 buffer. To the third test tube, add 1 mL of pH 9.0 buffer. Create a data table to enter your results for each of these test tubes over time.
Step 2: Based upon your knowledge of enzymes and the effects of pH on their activity, order the tubes from highest (1) to lowest (3) glucose production predicted over time. Add your predictions to the data table you created in step 1.
Step 3: Discuss with your partner how to calculate a rate of sucrase activity for each pH.
Step 4: Make your sucrase enzyme solution per your teacher’s instructions. Add 1 mL of the sucrase enzyme solution to each of the tube and immediately start timing.
|
|
Solution |
Solution |
|---|---|---|
|
1 |
2mL sucrose and 2mL of pH buffer 4.4 |
3mL sucrase |
|
2 |
2mL sucrose and 2mL of pH buffer 7.0 |
3mL sucrase |
|
3 |
2mL sucrose and 2mL of pH buffer 9.0 |
3mL sucrase |
|
4 |
2mL sucrose and 2mL of pH buffer 13.0 |
3mL sucrase |
Step 5: Every 5 minutes for 15 minutes, record the concentrations of glucose in each tube using the color chart that came with the test strips (if available) and record in your data table. Or wait 10 minutes and test with Benedicts.
Step 6: Calculate the rate of enzymatic activity for sucrase at each pH. Using graph paper, graph your data of rates of sucrase activity versus pH. Which is the independent variable? Which is the dependent variable? Are the predictions you made in step 2 supported by your data? Explain how you know on your paper.
Guided Inquiry: pH
Step 1: Based on the data already collected, predict a pH range that includes the optimal pH for sucrase activity. How do you think you could more finely pinpoint the optimal pH for sucrase activity? Write your ideas on your paper.
Step 2: Determine how you would change the set-up of your test tubes to determine the optimal pH for sucrase activity. Once your teacher approves, create a table to record your data, prepare your test tubes per your design, and record data on glucose production every 3 minutes for 15 minutes. Determine the rates of sucrase enzyme activity under each of your chosen conditions. Graph the rates of sucrase enzyme activity versus pH and estimate the optimal pH.
Step 3: Are the predictions you made in step 1 supported by your data? Is there any way you could improve your experiment? Discuss your answer with your lab partner and write it on your paper.
Assessment
- If an enzyme has an optimal activity at 25°C, what do you think will happen to the enzyme’s activity if the temperature is raised to 37°C? Why?
- If an enzyme has a largely acidic active site, what do you think will happen to the enzyme’s activity if the pH is made basic? Why?
Activity
- How could we determine experimentally the specificity of an enzyme to its substrate?
- Discuss the answer to question 1 with your group.
Substrate Specificity of the Enzyme Sucrase
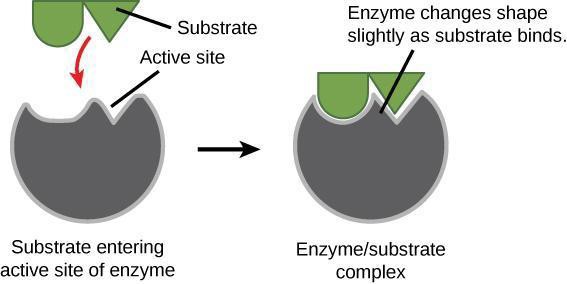
An enzyme’s active site contains side chains of the amino acids that can only bind to certain molecules. For example, if the active site is largely positively charged, then negatively charged substrates will be attracted. Additionally, the three-dimensional shape of the active site within the enzyme is key in determining which substrates will fit into the active site (Figure 7.3). What does this suggest about how specific enzymes are to their substrates?
Safety Precautions
- Goggles should be worn at all times while in laboratory.
- No open-toe shoes worn in laboratory.
- Measure fluids carefully using graduated cylinders to avoid breakage and spillage.
- Inform your teacher immediately of any broken glassware as it could cause injuries.
- Clean up any spilled fluids to prevent other people from slipping.
For this activity, you will need the following:
- Graduated cylinder
- Beaker
- Water
- 20 mg/mL lactose solution
- 20 mg/mL sucrose solution
- Various foods for testing for presence of lactose, including both dairy products and those marketed as lactose-free
- Lactase
- Test tubes
- Stirring rod
- Timer
- Labeling pencil
- Glucose test strips
- Graph paper
For this activity, you will work in pairs.
Structured Inquiry
Step 1: Prepare two test tubes, one with 2 mL of 20 mg/mL lactose and the other with 2 mL of 20 mg/mL sucrose. Label one tube as lactose-containing and the other as sucrose-containing. Create a data table to enter your results for each of these test tubes over time.
Step 2: Based on your knowledge of enzymes and their specificity, predict whether you will observe enzyme activity for each of the two tubes indicated above. Add your predictions to the data table you created in Step 1.
Step 3: Discuss with your partner how to calculate a rate of lactase activity for each substrate.
Step 4: Make your lactase enzyme solution per your teacher’s instructions. Add 1 mL of the lactase enzyme solution to each of the two tubes listed above and immediately start timing. Immediately after adding the lactase enzyme solution, determine the glucose concentration in each tube using glucose test strips and the color chart that came with the test strips. Record this in your data table.
Step 5: Every 3 minutes for 15 minutes, record the concentrations of glucose in each tube using the color chart that came with the test strips and record in your data table.
Step 6: Calculate the rate of enzymatic activity for lactase in each substrate. Using graph paper, make a bar graph showing the rates of lactase activity in each of the two substrates. Are the predictions you made in step 2 supported by your data? Explain how you know on your paper.
Guided Inquiry
Step 1: Based upon what you have learned, how could we use this assay for lactase activity to determine the relative amounts of lactose in various food products, including typical dairy products as well as those that are advertised as lactose-free? Write your idea on your paper.
Step 2: With your lab partner, choose two food products to test—one that you suspect contains lactose and one that is supposed to be lactose-free. Determine how you would change the setup of your test tubes above to assay for lactase activity in food products. Once your teacher approves your experimental design, create a table to record your data, prepare your test tubes per your design, and record data on glucose production every 3 minutes for 15 minutes. Determine the rates of lactase enzyme activity for each food product. Make a bar graph showing the lactase activity for each of the two foods chosen.
Step 3: Are the predictions you made in Step 1 supported by your data? Is there any way you could improve your experiment? Discuss your answers with your lab partner and write them on your paper.
Assessment
- How can substrate specificity of an enzyme be used to determine the presence of its substrate in a sample? Explain in terms of the active site.
- What might you conclude if you observed glucose in a lactose-free food at the start of the experiment?
- How could enzyme specificity be used to determine the concentration of a substrate in a food product?
to breakdown or unfold a molecular conformation
biological catalysts, many of which are proteins
