8 PHOTOSYNTHESIS
Learning Objectives
- Measure the dependence of CO2 fixation on the light-dependent reaction.
- Explain the chemical principles of pH indicators and the bicarbonate-CO2equilibrium.
- Analyze the dependence of O2 production on the color of light spectrum and other environmental variables.
Activity
- Which gas is released by plants during photosynthesis? Which gas is absorbed during photosynthesis? How does the overall chemical equation for photosynthesis compare to the overall chemical equation for respiration?
- What chemical reactions take place when CO2 is released in water? What is the connection between an increase in CO2 in the atmosphere and the acidification of oceans? Why are plants essential in mitigating the effects of climate change?
- Discuss the answers to questions 1 and 2 with the group.
Influence of the Light Reaction on the Concentration of CO2
In this experiment, you will predict and test the effect of environmental conditions on the process of photosynthesis. Gaseous carbon dioxide dissolves in water per the reaction
CO2 + H2O↔ H2CO3 ↔ H+ + HCO3–
Carbon dioxide and water combine to generate the unstable carbonic acid molecule that separates into hydrogen and bicarbonate ions effectively lowering the pH of the solution. The reaction is reversible. When CO2 molecules are consumed by photosynthesis, the reaction shifts to the left. Hydrogen ions and bicarbonate ions combine to replace CO2 with the net effect of increasing the pH of the solution.
A pH indicator is a chemical compound that changes color based on pH level. In this experiment, you will use phenol red, which appears yellow at pH below 7, orange at neutral pH, and bright red or pink at basic pH values (see Figure 11.1). How can the presence of phenol red allow measurement of the consumption of CO2 by a plant submerged in water? Discuss the method with your partner and write your answer on your lab paper.
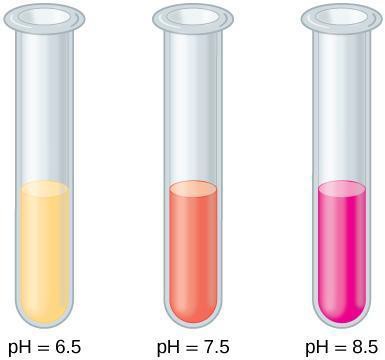
Figure 11.1: The pH indicator phenol red appears yellow at an acidic pH, pinkish orange at a neutral pH, and bright red or pink at a basic pH.
Safety Precautions
- Be careful when blowing into the straw inside the reaction vessels. Do not suck up the solution.
- Do not touch incandescent lamps, because they can be very hot.
- Wear aprons and eye protection.
For this activity, you will need the following:
- Plant material: Elodea or other aquatic plant
- Flasks
- Transfer pipettes
- Solution of phenol red
- New drinking straws
- Test tubes and test tube racks
- Lamp with LED bulb
- Beakers of water
- Hot plate
- Ice
- Aluminum foil
- Thermometer
- Meter stick
For this activity, you will work in pairs.
Structured Inquiry
Step 1: In this experiment, you will measure CO2 uptake in Elodea exposed to light compared to a control Elodea in a control tube where light is blocked. Make a hypothesis with your partner about the color changes you expect to see in the pH indicator when the test tubes are exposed to light. Write down your hypothesis on your lab paper. Discuss what you predict will happen to the test tubes kept in the dark. Decide what you will do if you observe no change in the test tubes exposed to light within the time allocated.
Step 2: Set up the materials described in Step 3 below. If you have access to a camera, you may take pictures of your set-up. Otherwise, draw the set-up on your lab paper indicating the colors in words or by using colored crayons. What is the control treatment in this setup? Is it a positive control or a negative control? Explain your reasoning on your paper.
Step 3: Monitor the photosynthetic response by following CO2 uptake, as outlined in the following steps.
- Prepare test tubes for the experiment. First, label all tubes with a piece of tape and a marker to identify the sample. The first tube will contain the sprig of Elodea exposed to light. This is the experimental sample that will be labeled Light. The second tube will contain a sprig of Elodea and will be wrapped in aluminum foil. Label this tube Dark Control because it will serve as a control. The third tube will be labeled Light Control and will contain water and indicator without plant material.
- Prepare a dilute solution of phenol red (mixed with tap water) in sufficient quantity for the test tubes. For example, if you set up test tubes that will contain 25 ml each, prepare 120 ml of solution to make it easier to aliquot equal amounts of solution. If the color is close to red or pink, it means that the tap water is basic. In this case, it may be more practical to use distilled water; since it may be difficult to blow enough CO2 to adjust the pH. The reason for using distilled water is that freshly distilled water has a pH of 7.0. As CO2 from the atmosphere dissolves in the distilled water, the pH drops below 7.0.
- If the starting phenol solution is a light shade of pink, take a clean drinking straw and gently blow bubbles into the solution until just after the solution turns yellow. What does the yellow color indicate? Write your answer on your paper.
- Fill test tubes with water as indicated by your teacher (see Step 2). Then add the pH indicator solution.
- Cut leafy sprigs of Elodea with the scissors without crushing the material. To produce comparable results, the sprigs should be similar in length and number of leaves.
- Place the sprigs in the test tubes you prepared for the experiment. Top with water to make sure that the sprigs are fully immersed.
- Record the color of each solution on your paper in a table like Table 11.1. Remember to modify the table to accommodate all your data.
- Wrap a piece of aluminum foil around the tubes if you are measuring photosynthesis in the Dark Control tube. Make sure that there are no light leaks.
- Place a lamp about 0.5 m from your experimental set-up. Place a container of water between the lamp and the test tube to absorb the heat radiating from the bulb if you use an incandescent bulb, as shown in Figure 11.2. LED lamps radiate less heat making it possible to bypass the use of a heat sink.
- Start your watch and record the color of the tap water with phenol indicator solution every 30 minutes. To compare CO2 production in the presence and absence of light, record the end-point color of the test tubes wrapped in aluminum foil after two hours of incubation.
Table 11.1: Change in Phenol Red Color
|
Time (min) |
Tube with Elodea exposed to light |
Tube without Elodea exposed to light |
Tube with Elodea in the dark |
Tube without Elodea in the dark |
|---|---|---|---|---|
|
0 |
|
|
|
|
|
30 |
|
|
|
|
|
60 |
|
|
|
|
|
90 |
|
|
|
|
|
120 |
|
|
|
|
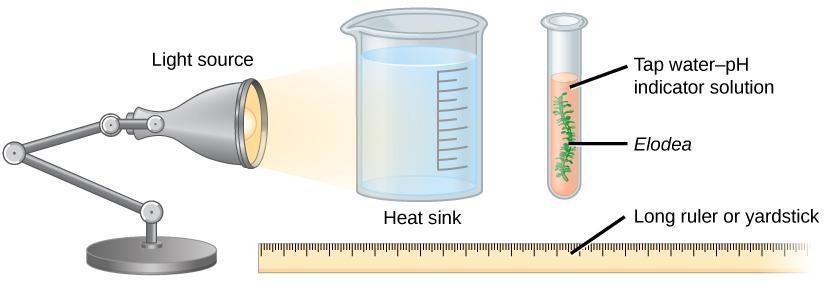
Figure 11.2: Experimental set-up to measure release of CO2 during photosynthesis.
Step 4: Record the colors you observe in the test tubes over time in the table you prepared on your paper. What happened to the Dark Control test tubes compared to the Light Control tubes and what does this tell you about the validity of your experiment? Do the experimental results support your hypothesis?
Guided Inquiry
Step 1: With your partner, review the process of photosynthesis and decide on an environmental condition you want to test. You may choose to investigate the influence of temperature or light intensity. Can you dim the room lights to minimize the effect of white light when experimenting with the effect of colored light? Decide with your lab partner how you will test the environmental condition and what you predict will happen to the pH in the solution. Include all necessary controls in your hypothesis. You should also devise a positive and negative control for your experiment. Check with your instructor on the availability of supplies to carry out your experiment.
Step 2: Set up your experiment following the guidelines described under step 2 of structured inquiry. You may need to shut off the room lights and cover the windows so there is only one light source. When measuring the effect of light intensity, use the equation I=1/D2 where I is light intensity and D is distance. In every case, ensure that you measure only one variable in your set up. The temperature can be kept constant by placing the tube in a water bath. Prepare a table like Table 11.1 on your paper to enter your data.
Step 3: Record your measurements on your paper. Analyze the results and compare them to your hypothesis. Did the environmental variable affect pH changes as you predicted? What do the changes in pH tell you about the changes in CO2 production? What other factors may have contributed to the results? If you measured the effect of temperature, explain which reactions in photosynthesis would be dependent on temperature? How would you modify the experiment if you were to repeat it? Discuss your results with groups that tested different environmental variables.
Assessments
- In an experiment, the water was first boiled, which drove out all of the existing gases. The water was then added to the test tube containing Elodea, which was then exposed immediately to light. The photosynthetic activity of the Elodea was then monitored but no photosynthetic activity was detected. How can you correct the situation by modifying the composition of the Elodea environment?
- Scientists report that the levels of carbon dioxide are rising in the atmosphere and driving climate change. Another observation is that acidification of oceans is also a consequence of climate change. Can you explain what link may exist between the two phenomena and how it affects the marine ecosystem?
- Farmers report that planting corn plants too closely can stunt growth even when the plants are heavily fertilized and receive plenty of light. Furthermore, the effect seems to be reduced in recent years. What is the growth limiting factor under these conditions? What may be an explanation? How do plants respond to decreased availability of the limiting factor?
Activity
- Spirogyra are thin, thread-like green algae that cluster up in rafts and float on the surface of ponds buoyed by bubbles of gas. What gas buoys the network of algae? What happens when there is no light?
- If chlorophyll absorbs maximally in the blue and red regions of the visible spectrum and carotenoids extend absorbance in the blue-green region, which color of irradiation will be the most effective: red, green, or white?
- Discuss the answers to questions 1 and 2 with your group.
Dependence of Photosynthesis on Selected Wavelength in the Light Spectrum
Several environmental factors influence the light-dependent reaction of photosynthesis. In this activity, you will investigate the rate of the light-dependent reaction by measuring indirectly the production of oxygen. Leaf disks are suspended in a solution of bicarbonate. A small drop of dishwashing soap in the solution breaks the surface tension of the leaf disks and allows the bicarbonate to penetrate inside the leaf. The bicarbonate in the solution provides a source of CO2 for photosynthesis. The inner spaces in a leaf are normally filled with air. When a bicarbonate solution is forced into those air spaces, the leaf disks become heavier and sink to the bottom of the solution.
As photosynthesis proceeds, the oxygen produced by Photosystem II (PSII) pushes liquid out of the air spaces and eventually bubbles out of the disks, which float to the surface. By monitoring the time it takes the disks to float, the rate of photosynthesis can be estimated under various conditions. To compare results of experiments, you will use the estimated time for 50 percent of the disks to float to the surface, labeled as ET50. This is a median value that allows you to discount outliers, such as a floating disk that never sank in the first place or a disk stuck to the bottom of the cup. Because ET50values decrease when photosynthetic rates go up, you may choose to plot 1/ET50 as a function of your independent variable.
Safety Precautions
- Wear goggles and an apron
- Use caution while working with the lamp, as light bulbs become very hot
- Use caution while handling glass
For this activity, you will need the following:
- Plant material: intact leaves of spinach, celery leaves, or cabbage (one leaf per pair of students)
- 0.2 M sodium bicarbonate solution
- Two to three plastic 10 mL syringes
- Clear plastic cups
- Dilute dishwashing soap solution
- Single-hole punch
- Lamps
- Aluminum foil
For this activity, you will work in pairs.
Structured Inquiry
Step 1: Discuss with your partner how the presence of light would affect the rate of photosynthesis. Write on your paper the justification for your predictions. Include the controls you will need to run a meaningful experiment.
Step 2: Set up of experiment
- Using a single-hole punch, punch 10-15 disks from an intact leaf being careful not to damage the leaf in the process.
- Transfer the disks to the barrel of a 10 mL syringe and replace the plunger.
- Pull about 4–5 mL suspension solution in the syringe. Tapping gently on the barrel until all disks float freely
- Push the plunger to expel excess air.
- Create a vacuum in the syringe by holding your index finger on the tip of the syringe where the needle would be inserted and slowly draw the plunger down. You will feel the vacuum pulling on your finger. Do not draw the barrel out of the syringe. The solution should be flowing into the airspaces of the leaf disks. Wait two to three minutes and release the vacuum. The disks should sink after you repeat this procedure two to three times. See Figure 11.3.
- Tap the syringe gently to re-suspend the disks and empty the contents of the syringe into a clear cup. Cover the disks with additional solution if needed to submerge them.
- Continue with your experimental set-up. Illuminate the clear cups with the lamp and record the number of floating disks every minute for 20 minutes. For the dark control, check the disks after 20 minutes.
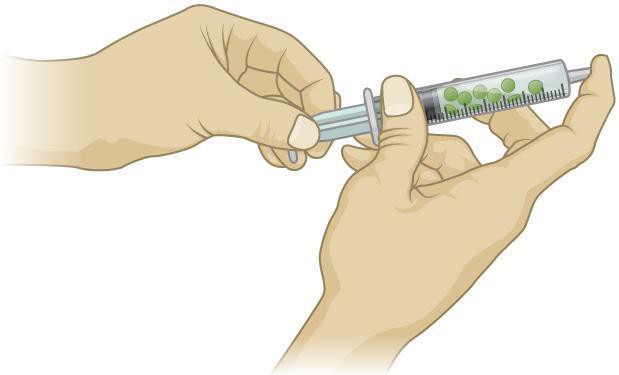
Figure 11.3: Pulling the barrel of the syringe and capping the tip with a finger creates a vacuum inside the syringe.
Step 4: Plot the number of floating disks for each condition as a function of time for each condition. Do the results confirm your hypothesis? Plot your results in a graph.
Guided Inquiry
Step 1: Discuss with your partner which conditions would impact the rate of photosynthesis in the disk. Conditions include the following:
- The effect of varying CO2 concentration. This is achieved by using different concentrations of a sodium bicarbonate buffer that releases CO2.
- Plant material differences, such as comparing the deep green leaves of spinach to the pale leaves of cabbage or celery
- Light intensity differences, such as by changing the distance between the light source and the cup
Recall that I=1/D2, where I is the intensity of light and D is the distance between the light source and the target. Choose a single variable you will study in your experiment. Write down on your paper the justification for your experiment and your prediction. How will it improve your understanding of photosynthesis? Include the controls you will need to run a meaningful experiment. Once you have determined a condition, discuss the feasibility of the experiment with your instructor and be prepared to modify your experiment. After choosing a condition, design your experiment carefully to limit the effect of a single variable.
Step 2: Sketch your set-up in detail and ask your teacher for approval. Modify your set-up per the feedback from your teacher if need be. Now you are ready to assemble all the materials that you will need to perform the experiment. Follow the instructions described in Step 3 under the structured inquiry. Count the number of disks that float over time to estimate the ET50. Enter all data in a table like Table 11.1, which you will adapt to your experimental conditions.
Step 3: Plot the number of floating disks for each experimental condition as a function of time and determine the ET50 for each condition. Plot the estimated photosynthetic rates using 1/ET50 as a function of your independent variable, either bicarbonate concentration or light intensity. Compare the 1/ET50 values for darkly pigmented leaves and pale leaves. In each case, discuss the validity of the data and how you would improve on the experiment. How reliable is it to use bicarbonate as a source of CO2? Can you compare light intensities without actually measuring light flux? Is it a fair comparison to use the response of disks from different types of plants? What else could have been at play?
Assessments
- In an experiment, water is labeled with the radioactive O18 isotope. The labeled water is then supplied to the leaf disks. In a second experiment, CO2 labeled with the isotope O18 is supplied to the disks. In which of the two experiments will you detect O18 in the product of photosynthesis? Why is this so?
- DCMU (3-(3, 4-dichlorophenyl)-1, 1-dimethyl urea) is an herbicide that specifically inhibits transfer of electrons from PSII. What would you predict would happen to the production of oxygen in an Elodea twig submerged in a solution treated with DCMU? How would an animal such as a water snail be affected by the presence of DCMU in the same environment? You can assume that DCMU doesn’t affect the snail directly.
- What would happen to gas bubbles in Elodea if a test tube is exposed to light for a prolonged period without aeration? What would happen if water snails were added to the test tube? Illustrate your answer with a diagram showing gas the interaction between the Elodea and the water snail.
a chemical compound that changes color based on pH level
