6 DIFFUSION AND OSMOSIS
Learning Objectives
- Test predictions from scientific hypotheses using basic biological laboratory techniques.
- Relate cell structure to function.
- Distinguish living organisms based on the characteristics of life.
Activity
- What happens when an air freshener is sprayed in a corner? What is the name of the process that causes the molecules to move?
- Do you think that the rate of the air freshener molecules moving would change if the room temperature was warmer or colder? Why or why not?
- Discuss the answers to questions 1 and 2 with the class.
Diffusion
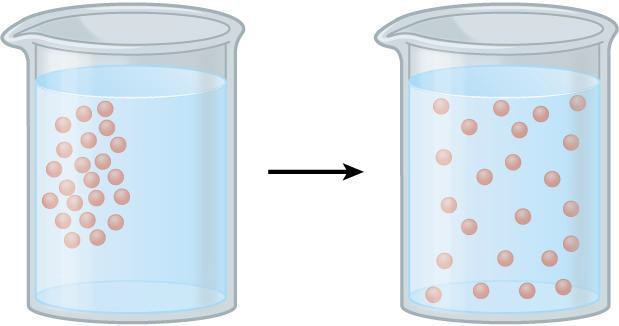
The movement of molecules from a higher concentrated area to a wider and less concentrated area is referred to as diffusion. For example, you can smell the aroma of food flowing through the atmosphere as you walk towards a cafeteria. Molecules collide with each other and are in constant motion because of their kinetic energy. This activity propels molecules to move where there is a less concentrated area. Therefore, the net movement of molecules is always from a tightly concentrated area to a less tightly packed area. Osmosis is the process of water diffusion through a selectively permeable membrane. In body systems, various constituents such as gases, liquids, and solids are dissolved in water when they flow through the cell membrane from a highly concentrated place to a less concentrated area in bodily systems. In a solution, the dissolved substance is called the solute and the substance in which the solute is dissolved is called the solvent.
Diffusion is the movement of molecules from an area where the molecule is highly concentrated to an area of low concentration, as illustrated in Figure 6.1. The rate of diffusion is dependent upon the temperature of a system, molecular size, and the medium through which diffusion is occurring (i.e., semi-solid, liquid, air). In this activity, we will be observing the diffusion of a dye through a beaker of water and through agar (a gelatinous substance), diffusion as a function of temperature, and diffusion as a function of molecular weight.
Safety Precautions
- Inform your teacher immediately of any broken glassware, as it could cause injuries.
- Clean up any spilled water or other fluids to prevent other people from slipping.
- Be careful with the dye as it can stain your clothes, and it should not be ingested.
- Wash your hands with soap and water after completion of the activity.
For this activity, you will need the following:
-
Whole milk
-
Distilled water
-
Microscope slides
-
Cover slips
-
Droppers or pipettes
-
Microscope
- Three 250 mL beakers
- Food coloring
- Agar plates
- Potassium permanganate
- Janus Green
- Methylene blue
- Thermometer
- Incubator
- Refrigerator
- Clock or timer
For this activity, you will work in groups.
Structured Inquiry Brownian Motion
Guided Inquiry Agar Diffusion
Step 1: Gather agar plates and dyes, provided by your instructor, that differ in molecular size: Janus green (mol. wt. 511.1 g/mol), methylene blue (319.85 g/mol), and potassium permanganate (mol. wt. 158.03).
Step 2: How would the rate of diffusion of a molecule through a gel compare to its rate of diffusion through water? How would the rate of diffusion differ between molecules of different molecular sizes? Write your ideas on your paper.
Step 3: The group will use 1 plate for determining how molecular size affects diffusion using the 3 dyes. Determine how best to measure movement of the dye in an agar plate. Be sure to keep the dyes far enough apart so that they do not touch once they start diffusing. Get your instructor’s approval before proceeding with the experiment. Measure the distance that the dye spreads in 20-minute intervals for 1 hour.
Step 4: Rank all 3 dyes in terms of diffusion rate. What was the relationship between diffusion rate and molecular size? Discuss your answers with your group and write them on your paper.
Assessment
- In a system, there is a concentration of molecules. However, on the outside, there is little to no concentration of this particular molecule. In which direction would the molecules be moving more so than the other direction?
- Diffusion is affected by what factors?
- Dye tends to move faster in warmer temperatures. Why is this?
Measuring Osmosis
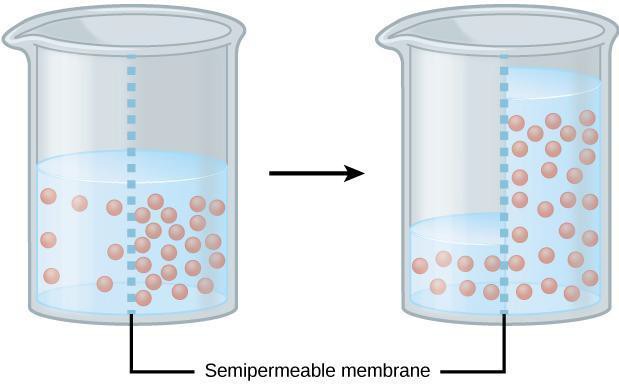
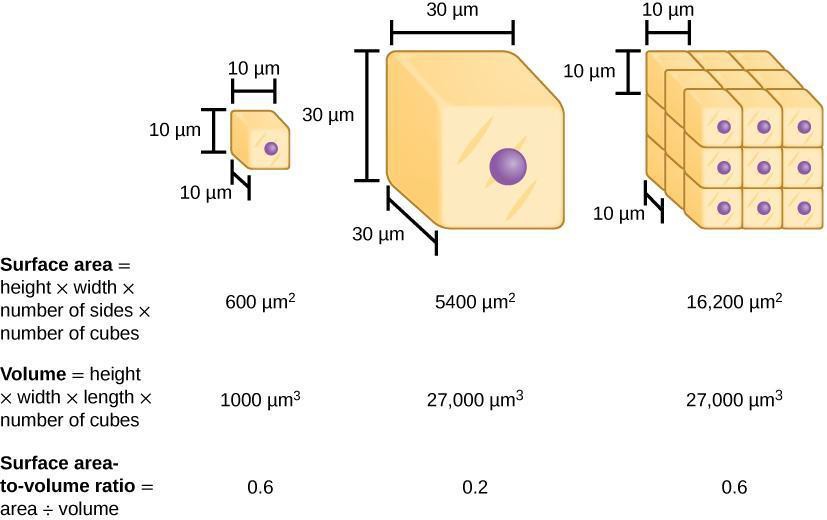
Osmosis is the diffusion of water across a selectively permeable membrane (i.e., cell membrane). Because of osmosis, water will move where water is less concentrated from an area of low solute (high water content) to an area with high solute concentration (low water content) (Figure 6.2). Dialysis tubing is used to model selectively permeable membranes because it will prohibit large molecules from crossing the membrane but will allow small molecules to cross. For example, water and glucose are small molecules that can easily cross the membrane. However, starch (a polymer of glucose), cannot cross due to its large molecular size. Additionally, cell surface area and volume can affect the rate of diffusion across a membrane. The surface area-to-volume ratio describes the relationship between the area outside the cell to the volume inside the cell (Figure 6.3). In this lab, we first will use dialysis tubing to model how the membrane selectively allows certain molecules to cross the membrane. Then, we will compare the diffusion rate of dialysis tubing with a small surface area-to-volume ratio to one that has a large surface area-to-volume ratio.
Safety Precautions
- Safety goggles/glasses should be worn when chemicals or solutions are heated.
- Handle all chemicals safely.
- Inform your teacher immediately of any broken glassware, as it could cause injuries.
- Clean up any spilled water or other fluids to prevent other people from slipping.
- Dispose of all chemicals per local regulations.
- Use caution when performing the Benedict’s reaction, which involves the use of a hot water bath.
For this activity, you will need the following:
- Dialysis tubing, two pieces, about 15 cm each long and narrow (pre-soaked)
- Dialysis tubing, one piece, short and wide (pre-soaked)
- Six Dialysis tubing clamps (optional)
- Three 500 mL beakers
- Water
- 5 percent Glucose solution, 10 mL
- Starch suspension, 10 mL
- Iodine
- Benedict’s reagent
- Graduated cylinder
- Test tube
For this activity, you will work in groups of four.
Structured Inquiry Osmosis
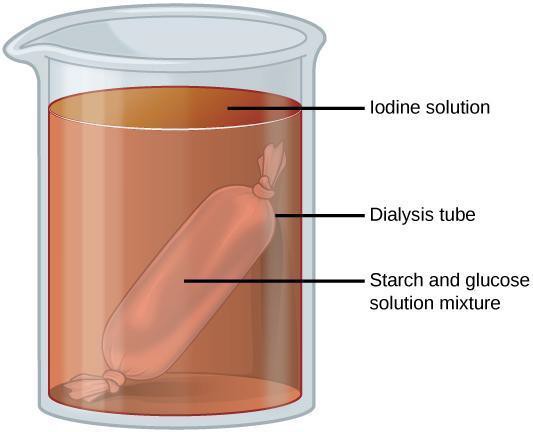
Step 1: Use a graduated cylinder to measure 250 mL of room temperature water in a beaker. Set aside. Obtain 1 piece of long and narrow dialysis tubing. Seal 1 end of the tube by tying a secure knot or attaching a dialysis tubing clamp to the end of the tubing. Put 10 mL of starch suspension and 10 mL of glucose solution in the tube. Then tie or clamp the other end of the tube. Place the sealed tube into the beaker (Figure 6.4). Develop and implement the use of an appropriate controlled experiment to go alongside your experiment. Allow both to sit for 20–30 minutes.
Step 2: Consider the molecular sizes of glucose and starch. What do you think will happen with the starch and the glucose inside of the dialysis tube? Predict whether starch and/or glucose will remain inside of the tube or if they will move out.
Step 3: Briefly remove the dialysis bag from the beaker and set it aside. Pour 2 mL of the water from the beaker into a test tube. Put 10 drops of Benedict’s reagent into the tube (note the initial color of the solution) and place into the hot water bath for 5 minutes. Note whether there is a color change. Place the bag back into the beaker. Put 20 drops of iodine into the water in the beaker. Allow this to sit for about 10 minutes. Determine whether starch is present in the bag and/or the beaker. Describe on your paper what you observe. Create a data table for your observations that shows whether starch and glucose were inside and/or outside of the dialysis tubing.
Step 4: Are the predictions you made in step 2 supported by your data? Why or why not? What methods could you use to improve your results? Discuss with your group and then write your answers on your paper.
Guided Inquiry Osmosis
Step 1: Predict what would happen to the rate of osmosis if the surface area-to-volume ratio was large (as it would be with small cells compared to larger ones). Record your prediction.
Step 2: Determine how the rate of osmosis of water using a dialysis bag with starch solution is affected if surface area-to-volume ratio is altered. Use dialysis tubing of 2 different lengths and widths to determine this. Record weights of each bag at different time intervals. Discuss with your group the time points at which you will check the bags for differences in weight over a 20-minute period. Record your data for each. Discuss with your group how best to set up these experiments.
Step 3: Create a graph that shows how osmosis rate is affected over time because of alterations in surface area-to-volume ratios. Are the predictions you made in Step 2 supported by your data? Why or why not? What methods could you use to improve your results? Discuss with your group and then write your answers on your paper.
Assessments
- Would a large protein have difficulty crossing the membrane of a dialysis tube? Why or why not?
- Why do smaller cells have more efficient diffusion compared to larger ones?
Osmosis in Living Cells[1]
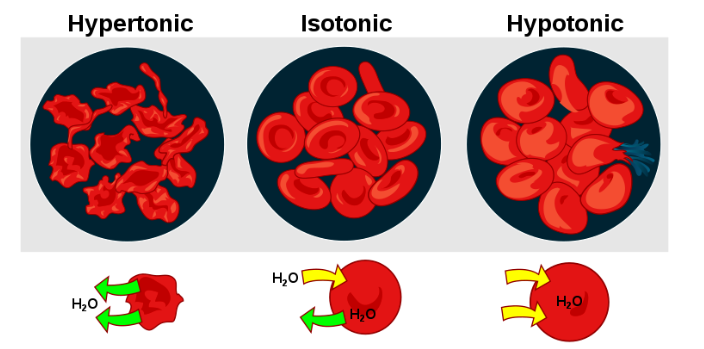
A cell lacking a cell wall is affected greatly by the tonicity of the environment. In a hypertonic solution where the concentration of dissolved solute is high, water will be drawn out of the cell. In a hypotonic solution where the concentration of dissolved solute is lower than the interior of the cell, the cell will be under great osmotic pressure from the environmental water moving in and can rupture (Figure 6.5).
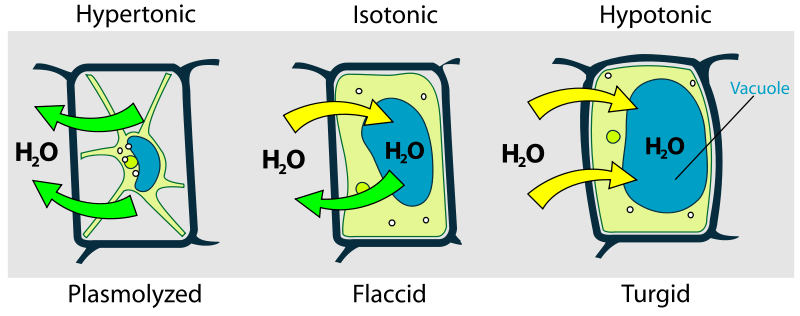
Plants have rigid cell walls composed of cellulose. These cell walls permit for maintenance of cellular integrity when the external environment is hypotonic (less dissolved substances). In this situation, the water moves into the cell. Without the cell wall, the cell would burst open from the excessive water pressure entering the cell. This state of swelling is referred to as turgid, resulting from turgor pressure (Figure 6.6).
The inside and the outside of a cell are mainly composed of water with dissolved solutes. The differences in solute concentration direct the movement of water across the plasma membrane of the cell. This difference between the two solutions (i.e., the cytoplasm and the extracellular fluid) is known as tonicity. Solutions are said to be isotonic if they both have equal concentrations of solute. The extracellular fluid is hypertonic to the intracellular fluid if it has a higher solute concentration. On the other hand, a lower solute concentration in the extracellular fluid compared to the inside of the cell would mean that the outside of the cell is hypotonic to the inside.
We can observe tonicity in Elodea leaves by placing them into different solutions with various solute concentrations.
Safety Precautions
- Be careful handling glass slides; the edges may be sharp.
- Observe proper use of the microscope; avoid handling the electric cord with wet hands.
- Do not use the coarse adjustment knob of the microscope at higher magnifications.
- Inform your teacher immediately of any broken glassware, as it could cause injuries.
- Clean up any spilled water or other fluids to prevent other people from slipping.
- Handle all chemicals safely.
For this activity, you will need the following:
- Two glass slides
- Elodea leaves
- Two coverslips
- Distilled water
- 10 percent NaCl solution
- 30 percent NaCl solution
- Microscope
- Potato cubes
- Electronic balance
- Weigh boat
- Three 50 mL beakers
For this activity, you will work in groups of four.
Structured Inquiry Elodea
Step 1: Obtain 2 glass slides and 2 cover slips. On 1 slide, place an Elodea leaf and put 1 drop of distilled water. Make a second slide with an Elodea leaf but put a drop of 10% NaCl. Allow these to sit for 2–3 minutes.
Step 2: Predict what will happen with the leaf that has been placed into NaCl. What do you think will happen to the leaf in water? Record your predictions.
Step 3: Determine what happens to the Elodea leaf cells in both solutions by observing them under the microscope. Record your observations for each. Draw pictures that demonstrate what you observe.
Step 4:Are the predictions you made in step 2 supported by your data? Why or why not? What methods could you use to improve your results? Discuss with your group and then write your answers on your paper.
Guided Inquiry Potato
Step 1: What happens to a cell in an isotonic solution? Hypertonic? Hypotonic? Predict what might happen to a potato in these solutions. Will it gain, lose, or maintain its weight? Write your idea on your paper.
Step 2: Design a study that would test your hypothesis in step 1. Plan which solutions you will use and how to determine if osmosis happened in each. Show your design to a teacher for approval, then create data tables that you would need to test your hypothesis. Write your results on your paper and create a graph or table to summarize your results.
Step 3: Discuss your results with your group. Are your results what you expected? How can you improve your experiment? Write your ideas on your paper.
Assessment
- Have you ever seen a slug hanging out on the steps? Oftentimes, people use salt to get rid of them. What do you think this does to the slug in terms of osmosis?
- How can you predict whether osmosis will occur into or out of a cell?
- Describe what is meant when we say that a cell membrane is selectively permeable. What types of molecules might have a difficult time crossing the membrane?
Structured Inquiry Brownian Motion portion of this chapter is by Professor Mary Gard. Licensed: CC BY NC SA
Structured Inquiry Wet Mount protocol provided by Professor Bryan Coppedge. Licensed: CC BY NC SA
passive transport process of low-molecular weight material according to its concentration gradient
passive transport process of low-molecular weight material according to its concentration gradient
situation in which extracellular fluid has a higher osmolarity than the fluid inside the cell, resulting in water moving out of the cell
situation in which extracellular fluid has a lower osmolarity than the fluid inside the cell, resulting in water moving into the cell
small, disc-shaped anucleate cells filled with the protein hemoglobin in the blood that transport oxygen throughout the body
situation in which the extracellular fluid has the same osmolarity as the fluid inside the cell, resulting in no net water movement into or out of the cell
